
Figure 1.
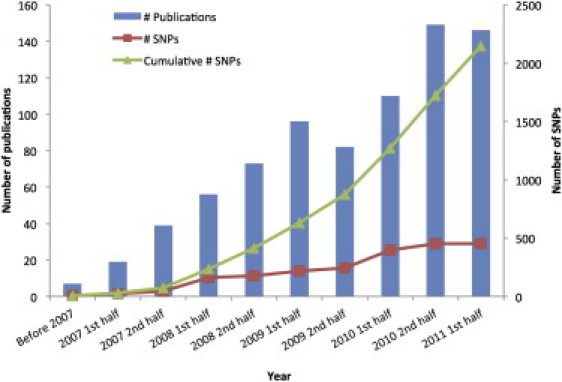
GWAS Discoveries over Time
Data obtained from the Published GWAS Catalog (see Web Resources). Only the top SNPs representing loci with association p values < 5 × 10⁻⁸ are included, and so that multiple counting is avoided, SNPs identified for the same traits with LD r2 > 0.8 estimated from the entire HapMap samples are excluded.