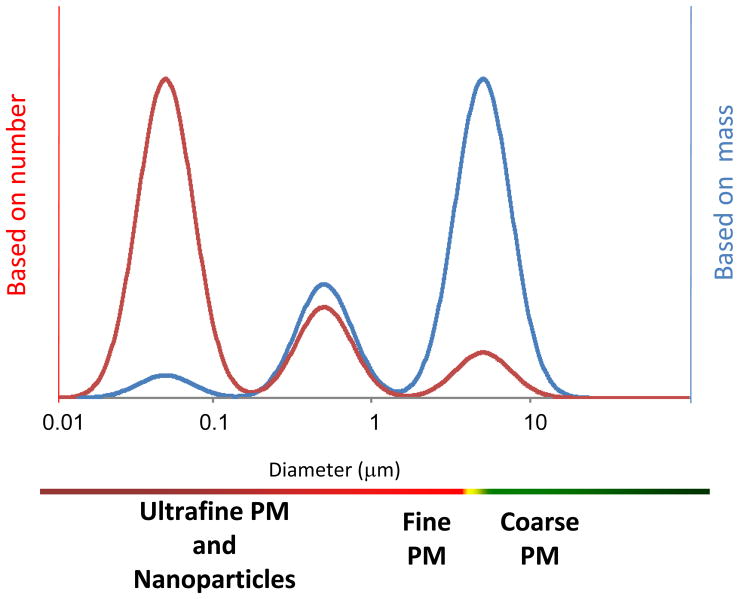
Figure 2.
The observed makeup of particle aerosols is a function of the metric of interest. For the mass distribution of particles (blue line) the dominant mode is generally larger than 1 μm, whereas on a number basis (red line) the dominant mode is usually less than 0.1 μm. In between those ranges is a mode where the majority of the surface area occurs, usually around 0.2–0.3 μm. While it is accepted that particles < 1 μm exist (nanoparticles), these particles tend to form aerosol agglomerates, which are represented within this distribution.

