
Figure 2. Bax is activated following 2DG treatment.
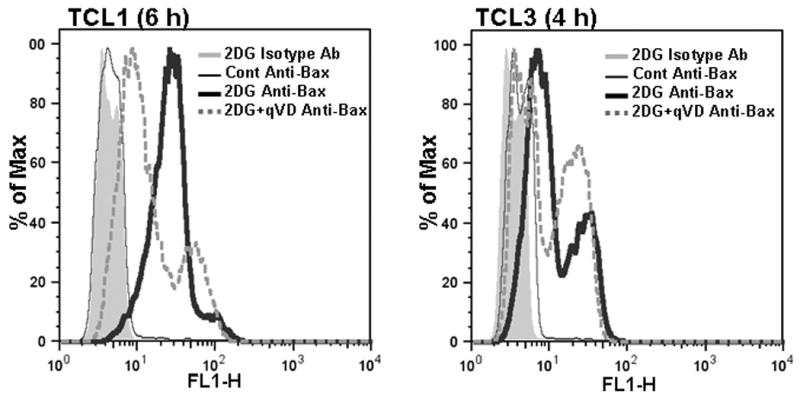
TCLs were treated with 2DG (20 mM) and with Q-VD-OPh (50 μM, qVD) as indicated. After 4 h (TCL3) or 6 h (TCL1) cells were labeled for the active conformation of Bax and analyzed by flow cytometry as described in methods. Histograms of the following samples are shown: 2DG treated cells stained with isotype control antibody (shaded gray), untreated cells stained with Anti-Bax (thin black line), 2DG treated cells stained with Anti-Bax (thick black line), 2DG+qVD treated cells stained with Anti-Bax (thick dotted gray line).