
Figure 3. Bcl-2 expression protects from 2DG toxicity.
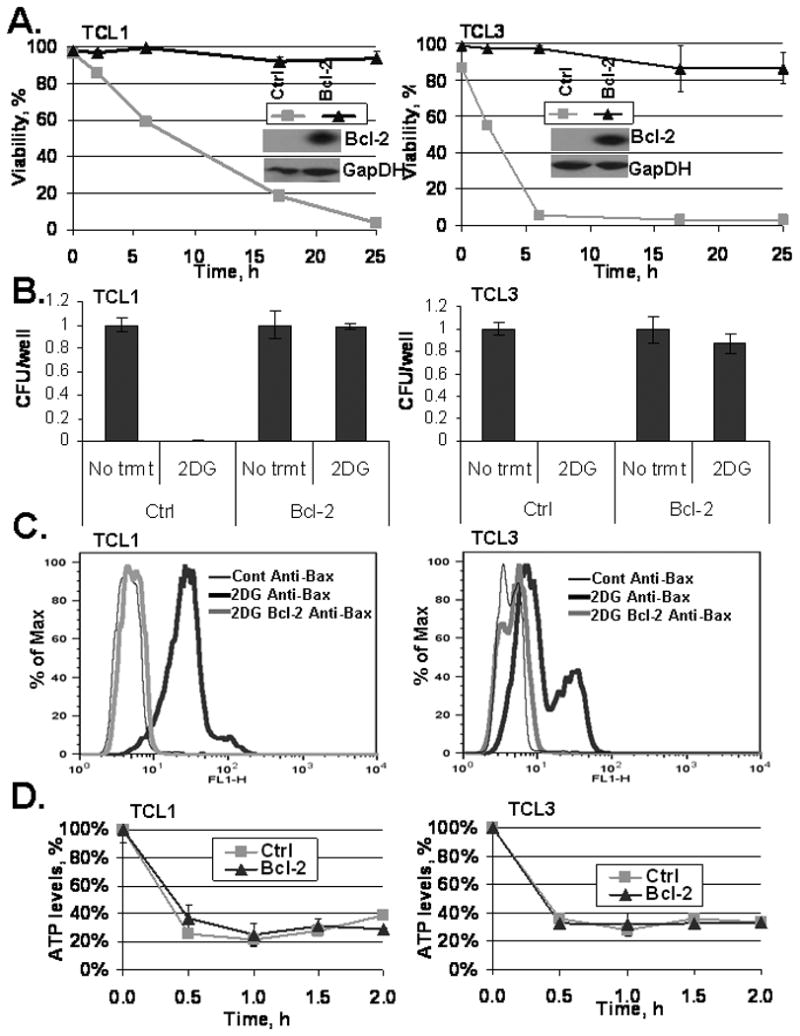
(A) Western blot of TCL1 and TCL3 following lentiviral transfection with either Bcl-2 Luciferase plasmid or Luciferase control plasmid (as described in methods). Control (ctrl) and TCL-Bcl-2 cells (Bcl-2) were treated with 20 mM 2DG and viability was assessed by Guava ViaCount dye exclusion assay at the times indicated. Data represent average viabilities ± S.D. (B) Clonogenic survival of control (ctrl) and TCL-Bcl-2 (Bcl-2) lines was measured following 24 h 2DG (20 mM) treatment as described in methods. Data represent average calculations of CFU/well from three 96-well plates ± S.D. (C) TCLs were treated with 20 mM 2DG (TCL1, TCL1-Bcl-2 for 6 h; TCL3, TCL3-Bcl-2 for 4 h), harvested, fixed, and stained to examine Bax activation as described in Fig. 2 and the methods. Histograms of the following samples are shown: Untreated TCLs (thin black line), 20 mM 2DG treated TCLs (thick black line), 20 mM 2DG treated TCL-Bcl-2 cells (thick gray line). (D) TCLs and TCL-Bcl-2 cells were treated with 20 mM 2DG for the time indicated and ATP levels were measured using a bioluminescent cell assay kit as described in methods. Data represent average ATP levels ± S.D.