
Figure 7. Bim upregulation and ER stress following 2DG treatment.
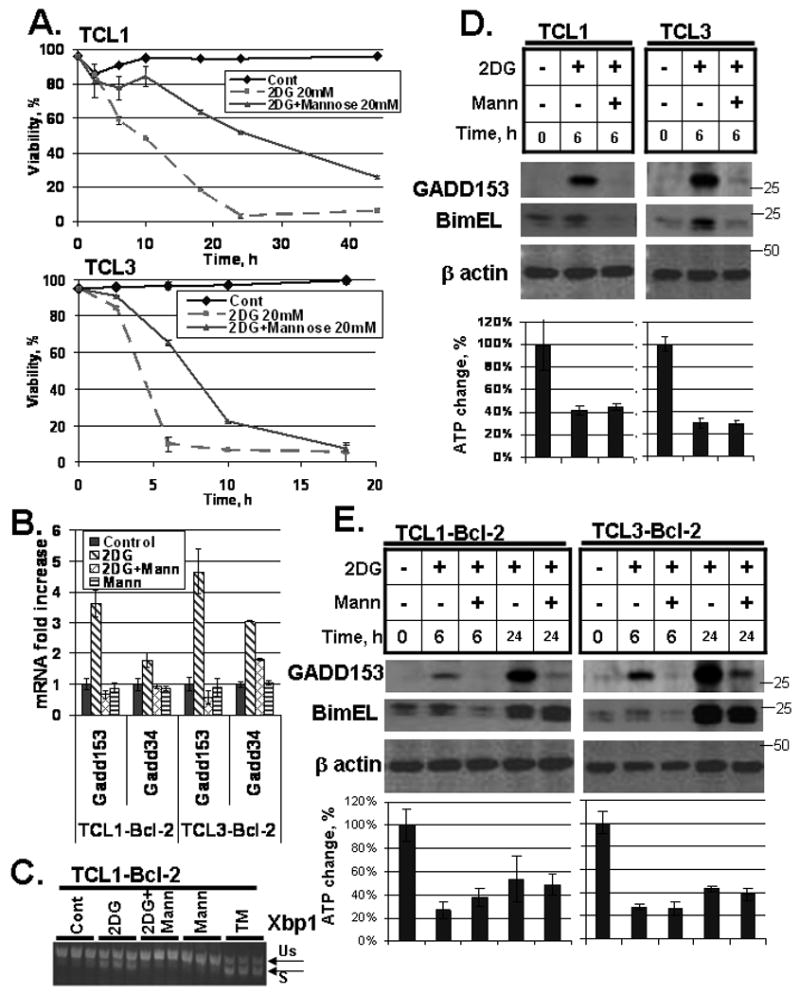
(A) Cells were treated with 20 mM 2DG and 20 mM mannose as indicated. Viability was monitored by Guava ViaCount. Data represent average viabilities ± S.D. (B) Cells were treated with 20 mM 2DG and/or 20 mM mannose for 6 h as indicated. mRNA levels of Gadd153 and Gadd34 are expressed relative to the levels in untreated samples. Data represent average mRNA levels ± S.D. from three independent samples. (C) Cells were treated with 20 mM 2DG, 20 mM mannose or 5 μM tunicamycin (TM; a positive control for ER stress) for 6 h as indicated. Splicing of Xbp1 mRNA was assessed by conventional RT-PCR, with spliced (S) and unspliced (Us) forms indicated. Replicate samples are shown. (D) Cells were treated with 20 mM 2DG and 20 mM mannose for 6 h as indicated. Protein levels were determined by Western blot as described in the methods section. ATP levels were measured as described in methods. Data represent average ATP levels ± S.D. (E) Cells were treated with 20 mM 2DG and 20 mM mannose for 6 h and 24 h as indicated. Protein levels were assessed by Western blot and ATP levels were measured as in (D).