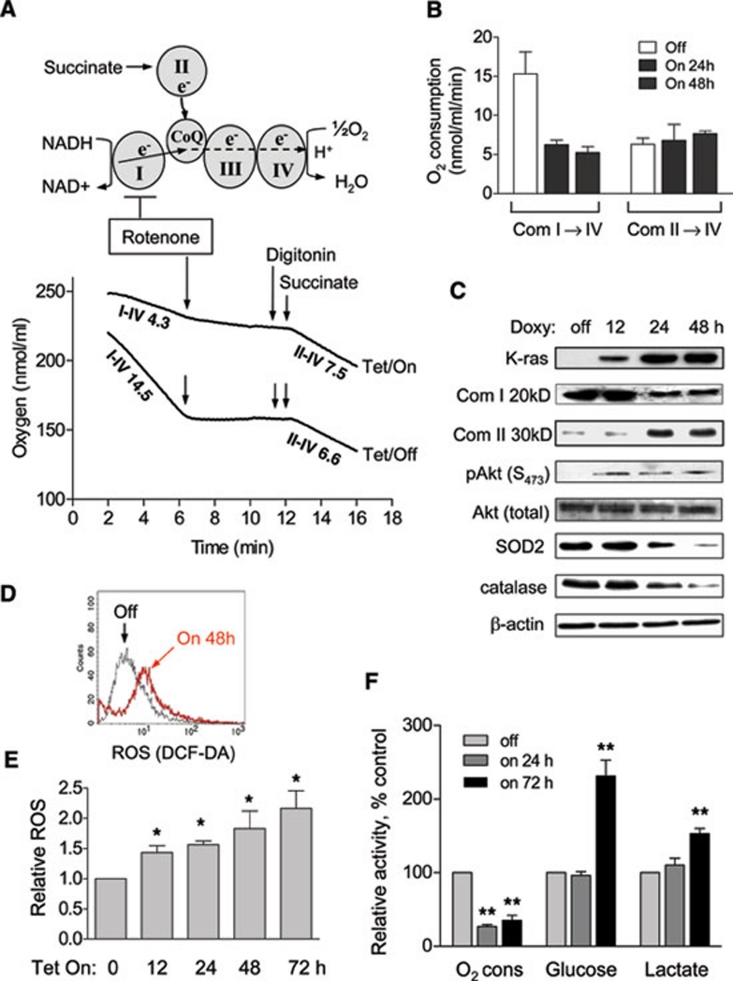
Figure 2.
Mitochondrial dysfunction induced by K-rasG12V activation led to metabolic alterations. (A) Experimental rationale of analyzing mitochondrial complex I and II activities and representative oxygen consumption curve of T-Rex-293 cells before and after K-ras induction for 48 h. The numbers indicate oxygen consumption rate (nmol/ml/min) of mitochondrial complex I to IV and II to IV. Arrows indicate the time points when reagents were added. Rotenone: 100 nM; digitonin: 30 μg/ml; succinate: 5 μM. (B) Quantitative analysis of oxygen consumption rates of complex I-IV and II-IV after K-ras induction. Data are mean ± SD. n = 3, *P < 0.05, **P < 0.01. (C) K-rasG12V induction caused a decrease of complex I 20 kD (Com I 20 kD) subunit and increase of complex II 30 kD (Com II 30 kD) subunit of mitochondrial respiratory chain and increase of phospho-Akt (S473). SOD2 and catalase were also inhibited 24 h after induction. (D) K-ras activation for 48 h caused a significant increase of ROS production measured by fluorescent probe DCF-DA. (E) K-ras activation caused an increase of ROS generation in a time-dependent manner. (F) Effect of K-ras activation on oxygen consumption, glucose uptake and lactate production. The metabolic parameters were measured 24 h and 72 h after K-ras induction.

