
Fig. 1.
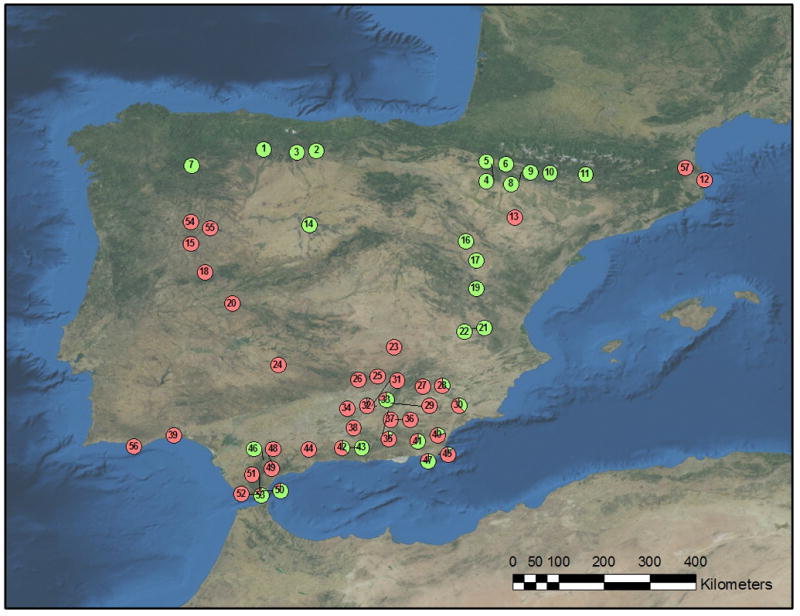
Distribution map of Brachypodium distachyon cytotypes in the Iberian Peninsula and geographical origin of the accessions selected in the study. The numbers refer to localities given in Supporting Information Table S1. The green portion of the pie charts depicts the proportion of diploid (2x) individuals within each population, and the red portion depicts the proportion of tetraploid (4x) individuals. Details on the populations and frequency of polyploids are given in Tables S1 and S2, respectively.