
Fig. 2.
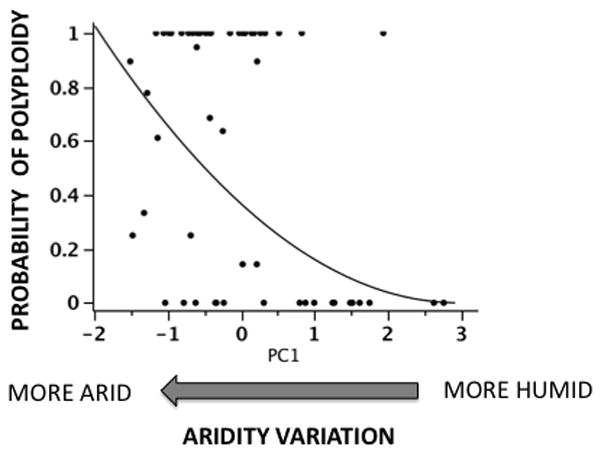
Variation in the probability of polyploidy (the probability of finding a tetraploid cytotype in any population, estimated from the frequency of polyploids/100) as a function of the PC1 factor, (humidity–aridity variation). Higher and positive values in this factor indicate higher precipitation and lower aridity; because it was positively correlated both with precipitation and the rainfall : temperature (R : T) ratio (see the Results section for details). A non-parametric regression (y-square root transformed) was fitted to the data (y = (0.61 − 0.2x) −1/2; F1,56 = 13.66, P = 0.0005; R2 = 0.2).