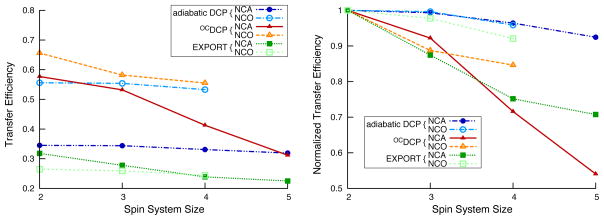
Figure 10.
Simulated NCA and NCO transfer efficiencies for adiabatic DCP, OCDCP, and EXPORT as a function of spin system size at 700 MHz for 1H and with νr=14 kHz. The graph to the left shows the transfer efficiencies, whereas the graph to the right shows the same data but normalized such that the two-spin result for each transfer method is set to 1.0. Filled symbols are for NCA transfers and hollow symbols are for NCO transfers. The spin systems used are illustrated in Figure 9. The simulations used a 8% gaussian RF inhomogeneity profile.

