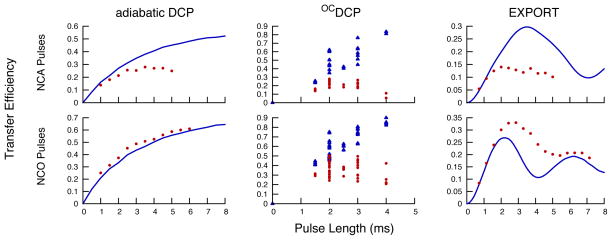
Figure 4.
Simulated and experimental NCA and NCO transfer efficiencies for adiabatic DCP, OCDCP, and EXPORT as a function of pulse length at 700 MHz for 1H and with νr=14 kHz. The blue lines (or blue triangles) represent simulation results and the red circles represent experimental results. As OCDCP pulses cannot be varied in length, a number of different pulses with pulse lengths between 1.5 and 4 ms were calculated and then simulated (blue triangles). The simulations used a 13C-15N two-spin system and a 8% gaussian RF inhomogeneity profile. The experimental results were acquired using a [U-13C, U-15N] SH3 sample and were measured relative to 13C CP-MAS spectra that were optimized for transfer to Cα or Co.

