
Figure 2. Results for the five lowest energy assignments obtained with XPLOR-NIH AssignFit for the 1H/15N SLF spectrum of 15N-Phe-labeled OmpX in magnetically aligned bilayers (n‖Bo).
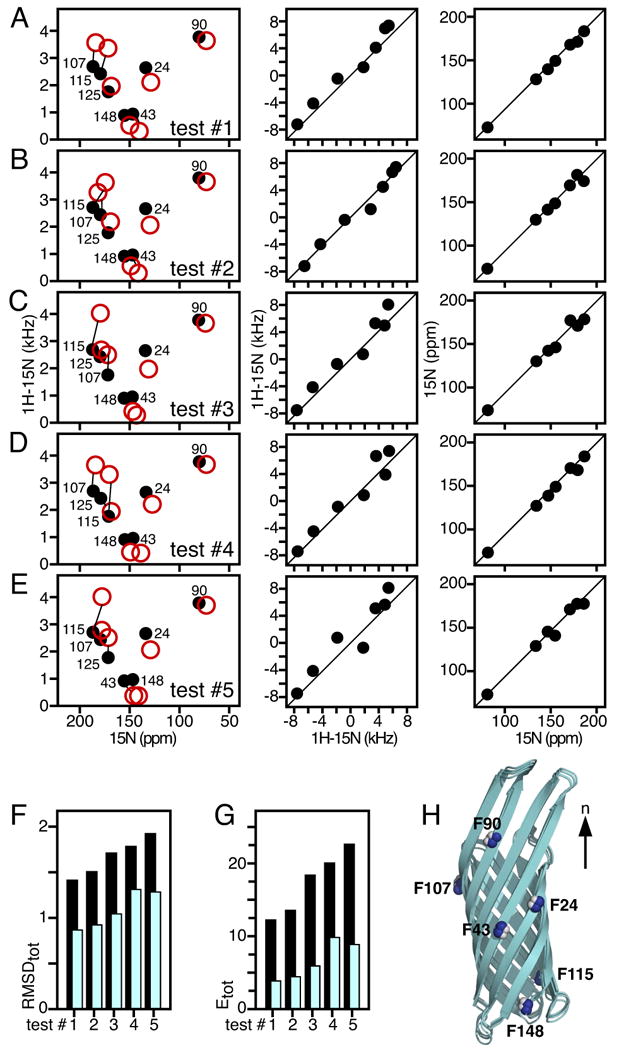
(A-E) Five lowest energy assignments showing observed (black) and back-calculated (red) peaks. For each test assignment (#1-5), the corresponding correlations between observed and back-calculated 1H-15N DC (middle) and 15N CSA (right) reflect the resulting RMSD (F) and energy values (G). (F, G) Total RMSD (F) and energy values (G) obtained for each of the five lowest energy assignments before (black) or after (cyan) structural refinement. (H) Overlay of the OmpX membrane orientations consistent with each of the five lowest energy test assignments obtained from AssignFit.