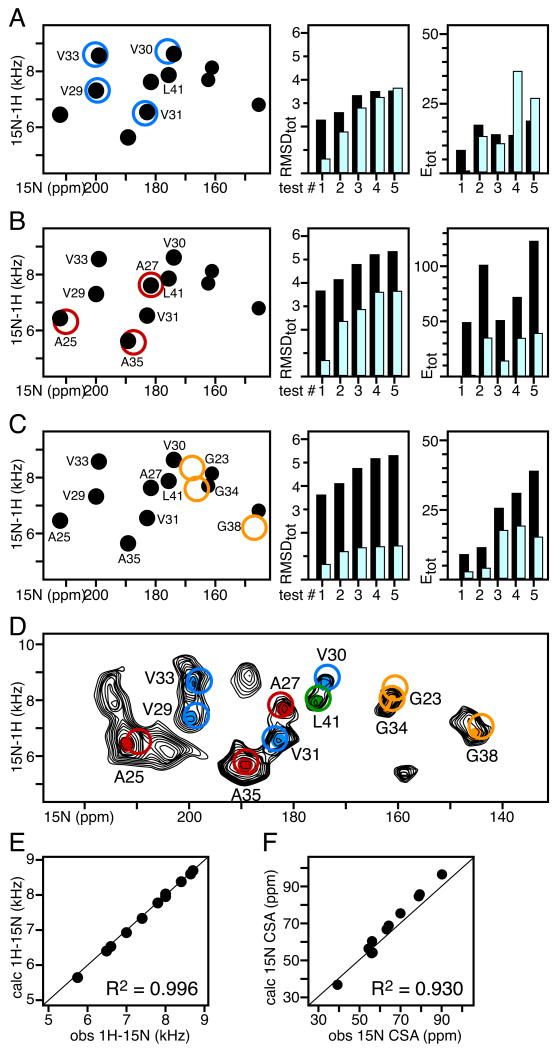
Figure 4. SASR with the 1H/15N SLF spectra of 15N-Val, Ala, Leu, and Gly labeled fd coat protein (transmembrane domain) in glass-aligned lipid bilayers (n‖Bo).
In all spectra, filled circles represent experimentally observed peaks. Unfilled circles represent frequencies back-calculated after structural model refinement with the assigned restraints. The peaks are color-coded by amino acid type: Val (blue), Ala (red), Leu (green), and Gly (gold). The spectral region corresponds to the protein's transmembrane domain. AssignFit was implemented with Da=10 kHz, kDC=1 kcal mol-1 kHz-2, kCSA=0.01 kcal mol-1 ppm-2. (A-C) Residue specific assignments of the Val, Ala, and Gly peaks were obtained using AssignFit, after fixing the L41 assignment, with: (A) an ideal helix structural model; (B) the structural model refined with Val DC and CSA restraints; (C) the structural model refined with Val, and Ala DC and CSA restrains. For each assignment/refinement cycle, the total RMSD and energy of the 5 lowest RMSD AssignFit results, obtained before (black) and after (cyan) model refinement, are shown on the right. (D) Experimental SLF spectrum from uniformly 15N-labeled fd (black) showing peaks from Ala (red), Val (blue), Gly (gold) and Leu (green), assigned with AssignFit. (E, F) Correlations between values of the 1H-15N DC and 15N CSA observed experimentally (obs) and back-calculated after refinement of the starting structural model (calc). The R2 correlation coefficients are listed for each correlation graph.

