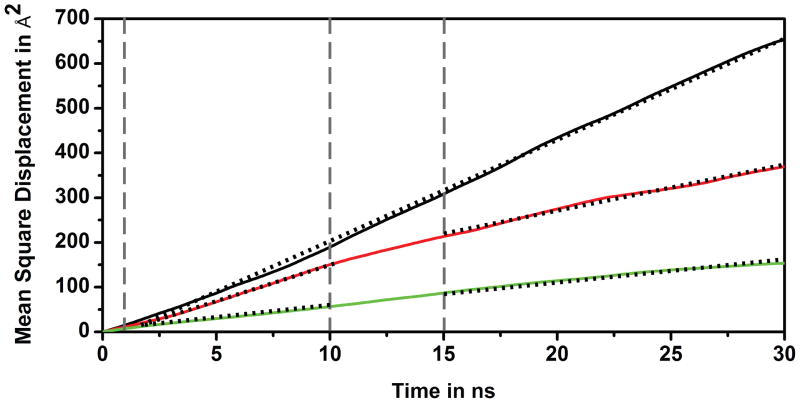
Figure 9.
Mean square displacement (MSD) for CI2 center of mass in CI2W (black), CI2LYS (green), and CI2BSA (red) simulations using all data after 30 ns. Vertical lines indicate short (1–10 ns) and long (15–30 ns) time regimes. Dashed lines indicate linear fits used to estimate diffusion coefficients.

