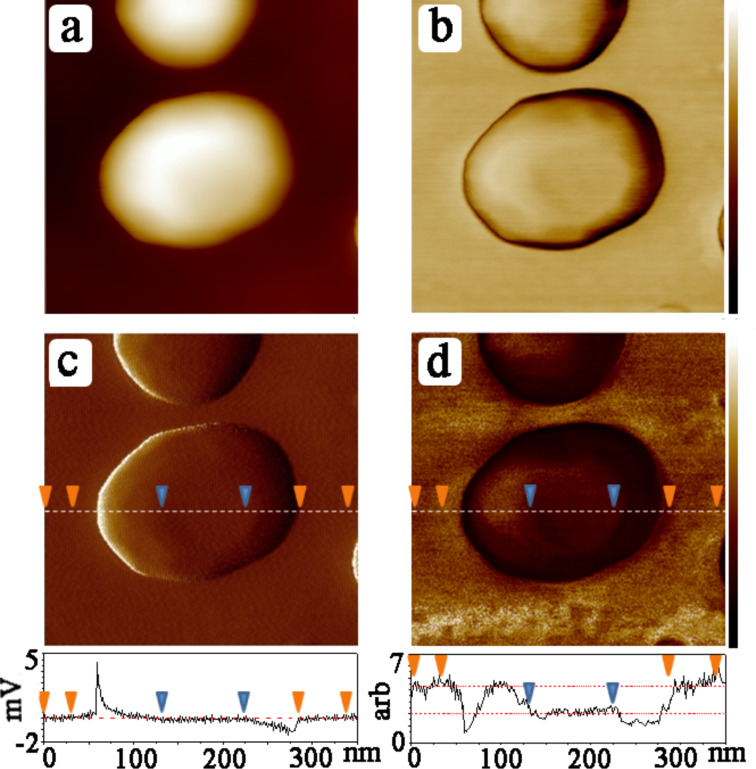
Figure 2.
(a) Topography (color bar: 0–70 nm), (b) phase (color bar: 0–15 degrees), (c) error signal (scale indicated in profile), and (d) modulus signal (scale indicated in profile) of SAM-coated Au islands on glass. Data taken from as prepared samples (no irradiation), corresponding to the trans configuration.

