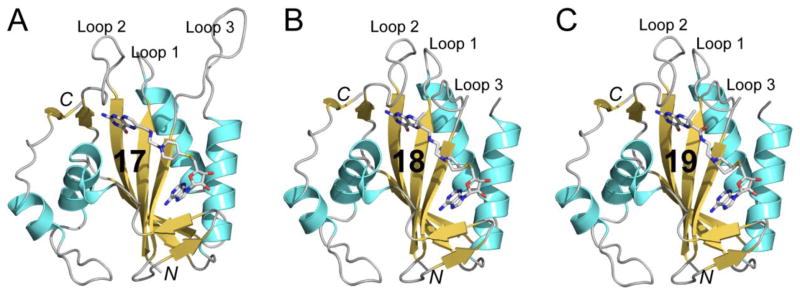
Figure 3.
Schematic illustration of crystal structures. (A) The HPPK•17 complex. (B) The HPPK•18 complex. (C) The HPPK•19 complex. Polypeptide chains are shown as a ribbon diagrams with helices (spirals) in cyan, strands (arrows) in orange, and loops (tubes) in grey. Ligands are shown as sticks in atomic color scheme (C in grey, N in blue, O in red, P in orange, and S in orange).

