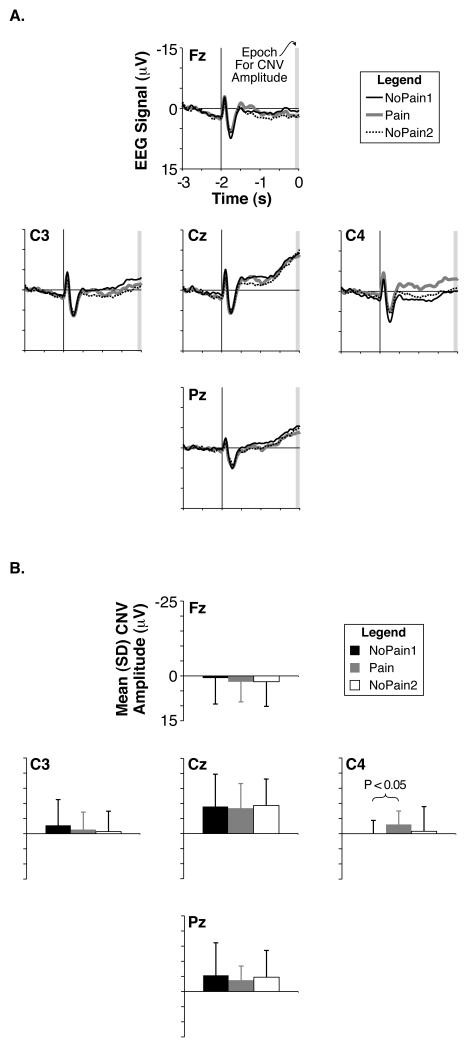
Fig. 3.
Grand mean CNV potentials. (A) Grand average EEG waveforms at frontal, central, and parietal midline electrodes (Fz, Cz, and Pz, respectively) as well as left-hemisphere and right-hemisphere dorsolateral central electrodes (C3 and C4, respectively) during the NoPain1 (thin black traces), Pain (thick gray traces), and NoPain2 (dotted black traces) conditions. The time scale is relative to the movement cue, with the warning cue illustrated at −2 s by a vertical line. The gray rectangle denotes the final 100-ms epoch prior to the movement cue used to calculate the average CNV amplitude. (B) Group mean CNV amplitudes calculated from the mean EEG amplitude of the final 100-ms epoch preceding the movement cue for each electrode and condition. Color and name schemes are the same as in (A) except the NoPain2 condition is represented by white bars.

