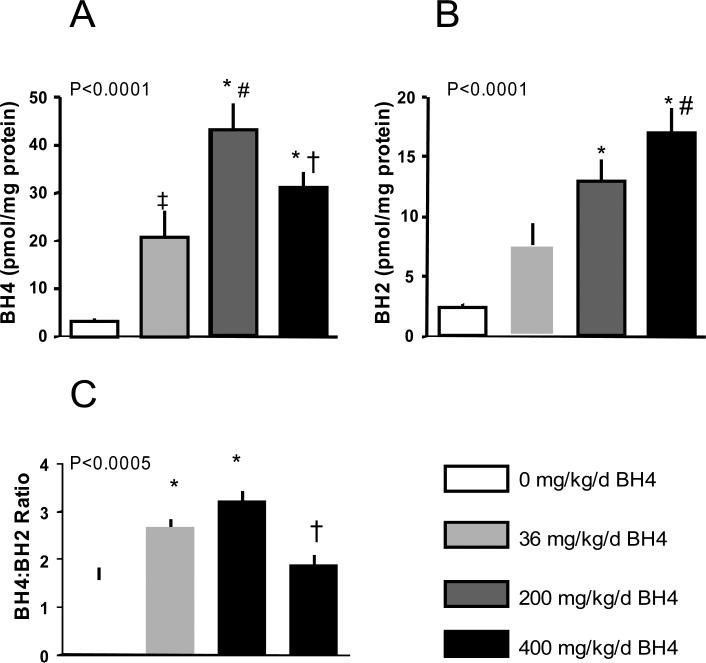
Figure 4.
Myocardial BH4 and BH2 levels after exogenous BH4 administration. BH2 increased in a dose-dependent manner, but there as a biomodal response in BH4, with an initial rise but later decline at the high dose. As a result, the BH4:BH2 ratio increased at lower but not the high dose. P-values in each graph are for 1-way ANOVA. Post hoc testing: A) * p<0.0001 vs no drug; # p<0.005 vs 36 mg/kg/d; † p<0.05 vs 200 mg/kg/d; ‡ p<0.03 vs no drug. B) * p<0.001 versus no drug; # p<0.02 versus 36 mg/kg/d. C) * p<0.02 versus no drug; † p<0.005 versus 200 mg/kg/d.

