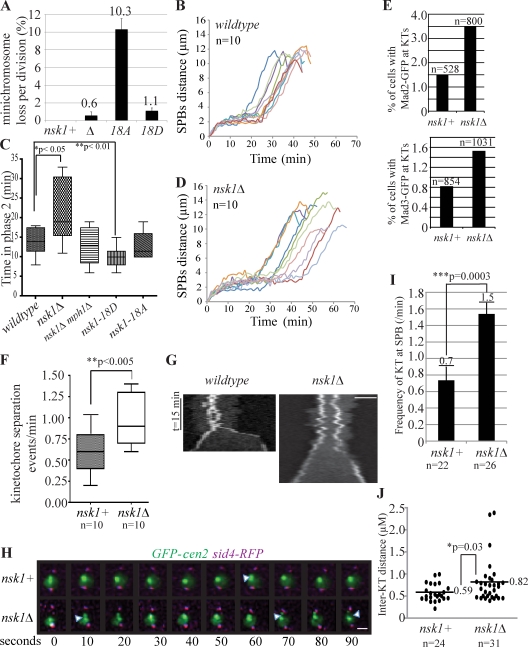
Figure 2.
Nsk1 is required for proper spindle dynamics and chromosome segregation. (A) Minichromosome loss rate was determined in the presence or absence of nsk1 mutations with SD from the mean of at least three experiments shown. (B–D) Spindle dynamics of the indicated strains were characterized by time-lapse microscopy. Spindle length (SPB to SPB, marked by Sid4-RFP) was measured at 1-min intervals. In B and D, each line represents data collected from an individual cell. In C, phase 2 duration data were extracted from spindle dynamics experiments as in B and D. (E) Asynchronous populations of the indicated strains were examined for the presence of Mad2-GFP (top)– or Mad3-GFP (bottom)–positive kinetochores (KTs) in the total number of cells indicated from more than two occasions of growth. (F–J) GFP-marked Cen2 and Sid4-RFP were imaged in mitotic nsk1+ and nsk1Δ cells at 10-s intervals. (F) In the 5 min before anaphase onset, the frequency of outward Cen2-GFP dot movements was quantified. (G) Kymographs of GFP-marked Cen2 in representative nsk1+ and nsk1Δ mitotic cells. Diffuse nucleoplasmic GFP signal shows the boundary of the nucleus. Bar, 2 µm. (H) Images from representative videos are shown. Arrowheads indicate kinetochore separation events. Bar, 1 µm. (I) Frequency at which kinetochores contacted an SPB during metaphase in the videos described above. Error bars represent SEM. (J) The interkinetochore distance before anaphase onset was also measured from the videos described above, and the maximum separation in each cell is provided. For all panels, n denotes the number of cells analyzed. Statistically significant differences were identified by two-tailed Student’s t tests with p-values indicated.

