Figure 5.
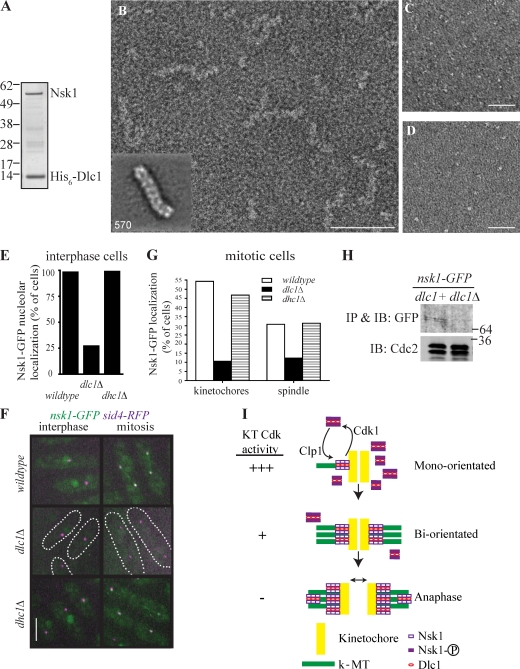
Structural characterization of the Nsk1–Dlc1 complex. (A) Coomassie blue staining of reconstituted Nsk1–Dlc1 complex. (B–D) Typical micrograph of negatively stained recombinant and purified Nsk1–Dlc1 (B), Dlc1 (C), and Nsk1 (D). Bars: (B) 50 nm; (C and D) 100 nm. (B, inset) Representative class mean of Nsk1–Dlc1 oligomers. The number of particles is shown in corner. The side length of the panel is 415 Å. (E–G) Nsk1-GFP was visualized in dlc1+ dhc1+, dlc1Δ, and dhc1Δ cells containing Sid4-RFP. (E) The percentage of interphase cells with detectable nucleolar Nsk1-GFP signal was determined in >100 cells of each strain from three occasions of growth. (F) Representative live-cell images of the indicated strains. dlc1Δ cells are outlined. Bar, 5 µm. (G) The percentage of mitotic cells, identified by the position and number of Sid4-RFP–marked SPBs with Nsk1 at kinetochores or on spindle, was determined in >50 cells of each strain from five occasions of growth. (H) Western blot of Nsk1-GFP immunoprecipitates (IP) from dlc1+ and dlc1Δ cells. Cdk1 levels in lysates used for immunoprecipitates are shown. IB, immunoblot. (A and H) Molecular mass is indicated in kilodaltons. (I) A model of Nsk1 function and regulation in chromosome segregation. See Result and discussion for details. KT, kinetochore.

