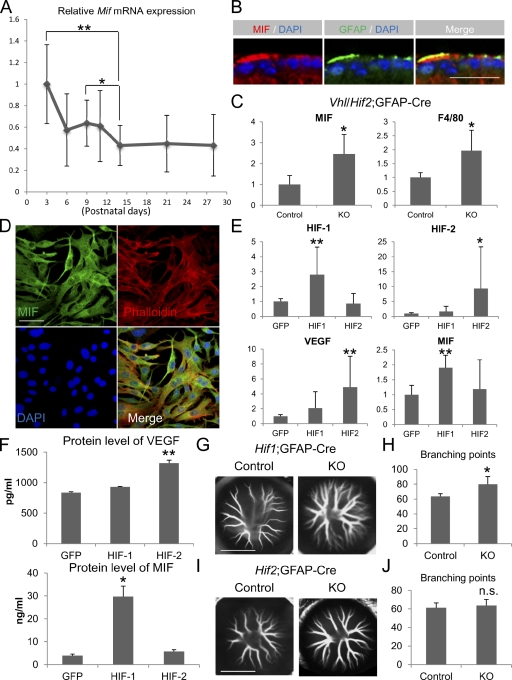
Figure 4.
HIF-1α, but not HIF-2α, regulates MIF in astrocytes. (A) Mif mRNA expression was monitored by real-time RT-PCR and plotted on a scatter plot at P3, 6, 9, 11, 14, 21, and 28 early postnatal stages of hyaloidal vessel regression in isolated retinas. Note that significant down-regulation is observed at P14 compared with P3 (n = 8). (B) Immunohistochemistry with MIF and GFAP antibodies in P14 retinal ganglion cell layer is shown. Note that MIF expression is colocalized with astrocytes in the ganglion cell layer. (C) Mif and F4/80 mRNA expression in Vhl/Hif-2α double mutants at P14. Note that the ectopic stabilization of HIF-1α in retinal astrocytes results in simultaneous (and significant) up-regulation of Mif and F4/80 (n = 4). KO, knockout. (D) Immunocytochemistry for MIF was performed on cultured C8-D1A murine astrocyte cells. Note that MIF is robustly expressed in the cytoplasm (visualized with phalloidin labeling) of C8-D1A cells (all cells are counterstained with DAPI). (E) Relative mRNA expression of Hif-1α, Hif-2α, Vegf, and Mif in C8-D1A cells transfected with CA–Hif-1α, CA–Hif-2α, or Gfp. Note that the transfection of CA–Hif-1α induces Hif-1α in C8-D1A (top left), and CA–Hif-2α induces robust Hif-2α expression (top right). Vegf is up-regulated significantly (4.9-fold; P = 0.00024) when C8-D1A cells are transfected with CA–Hif-2α. Mif is significantly (1.9-fold; P = 0.000057) up-regulated by CA–Hif-1α (n = 11–12). (F) VEGF and MIF-secreted protein levels were measured from supernatants of CA–Hif-1α or CA–Hif-2α–transfected C8-D1A cells using quantitative sandwich ELISAs (n = 5–6). VEGF secretion is significantly (2.7-fold; P = 0.009) up-regulated by CA–Hif-2α (top). MIF is significantly (7.6-fold; P = 0.03) up-regulated by CA–Hif-1α (bottom). (G–J) Representative hyaloidal vasculature (G and I) and number of branching points (H and J) in HIF-1α (G and H) or HIF-2α (I and J) mutants are shown at P9 (n = 6). Note that in HIF-1α mutants, delayed hyaloidal regression compared with control littermate is observed in early postnatal stages. n.s., not significant. *, P < 0.05; **, P < 0.01. Error bars indicate mean ± SD. Bars: (B) 20 µm; (D) 50 µm; (G and I) 2,000 µm.

