Figure 4.
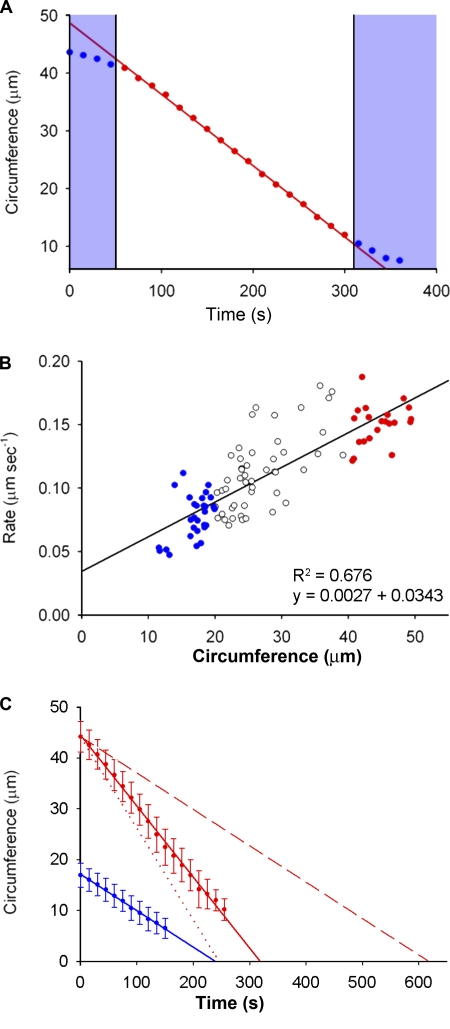
Rate and duration of actomyosin ring constriction in N. crassa. (A) A graph showing the linear decrease in ring circumference calculated from image analysis of the Lifeact-GFP signal over time in a representative cell. The time points in red correspond to the constant phase of ring constriction; time points in blue show those during ring assembly and at the end of constriction, after the final pore size has been reached. The areas shaded blue were excluded for the calculation of constriction rate. (B) The rate of ring constriction is size dependent and larger rings constrict at a faster rate. Each data point represents the rate measured during the linear phase of constriction for individual rings of initial circumference 10–20 µm (blue), 20–40 µm (white), and > 40 µm (red); n = 98. R2 values and equations of the lines are indicated. (C) Average duration of constriction in cells with large (mean circumference = 45 µm; red, n = 21) and small (mean circumference = 15 µm; blue, n = 29) initial ring circumference. Each data point represents the mean ring circumference of cells within that size category at a given time during ring constriction. Error bars represent the standard deviation from the mean; n ≥ 10 measurements for each time point. The dotted line indicates the result predicted in large cells if the constriction rate were fully scalable with size, whereas the dashed line indicates that if constriction rate is completely nonscalable and size independent.

