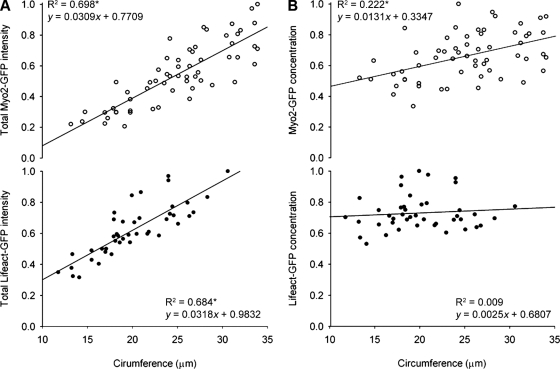
Figure 5.
Quantitation of total amount and concentration of ring-associated F-actin and myosin II. (A) Total amount of Myo2-GFP (open circles; top, n = 59) and Lifeact-GFP (closed circles; bottom, n = 43) expressed in relative units of fluorescence intensity, as a function of hyphal circumference at start of constriction. R2 values and equations of the lines are indicated. Asterisk indicates a correlation coefficient where P < 0.001. (B) Concentration of Myo2-GFP (open circles; top, n = 59) and Lifeact-GFP (closed circles; bottom, n = 43) expressed in relative units of fluorescence intensity per confocal volume, as a function of hyphal circumference at start of constriction. R2 values and equations of the lines are indicated. Asterisk indicates a correlation coefficient where P < 0.001.

