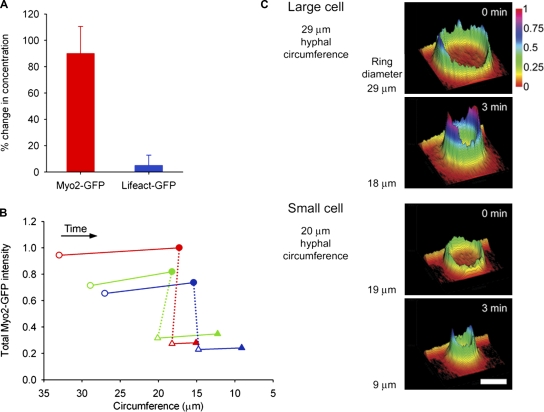
Figure 6.
Concentration of ring-associated F-actin and myosin II during ring constriction. (A) Change in concentration of Myo2-GFP (red) and Lifeact-GFP (blue) during 3 min of ring constriction, expressed as change in fluorescence intensity. Data shown is mean of nine (Myo2-GFP) or five (Lifeact-GFP) independent experiments; error bars indicate the standard deviation from the mean. (B) Total amount of ring-associated Myo2-GFP at start (open symbols) and after 3 min of constriction (closed symbols). Each color represents a pair in which the larger ring (circles) has constricted to the same circumference as the smaller ring (triangles) at initiation of constriction. The dotted line connects corresponding pairs. The amount of Myo2-GFP is expressed in relative units of fluorescence intensity, as a function of hyphal circumference. (C) Distribution and intensity of Myo2-GFP in a representative pair of rings as described (green dataset) in B. Heat and profile map shows the relative intensity of Myo2-GFP at the start and after 3 min of constriction.

