Figure 7.
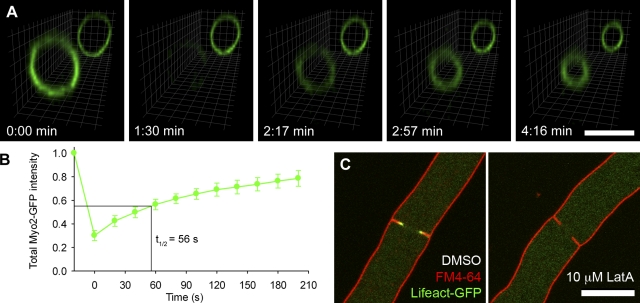
Turnover of myosin II and F-actin during ring constriction. (A) Fluorescence recovery after photobleaching (FRAP) of Myo2-GFP in a hypha with two rings in close proximity, rendered into a 3D image. The ring in the foreground was selectively photobleached while the second ring in the background remained unbleached. The time is indicated in minutes. Bar, 10 µm. See also Video 4. (B) Quantitation of FRAP of Myo2-GFP during actomyosin ring constriction. The whole ring was bleached and recovery was monitored as the change in intensity before and after bleaching, corrected for photobleaching resulting from the imaging. Data shown are the mean of 10 independent experiments, expressed in relative units of fluorescence intensity normalized to the corrected prebleach value; error bars represent the standard deviation from the mean. The half time for recovery is indicated on the graph. (C) Observation of Lifeact-GFP (green) and membranes labeled with FM4-64 (red) after inhibition of actin polymerization with DMSO alone (left) or 10 µM latrunculin A (right). Bar, 10 µm.

