Figure 2.
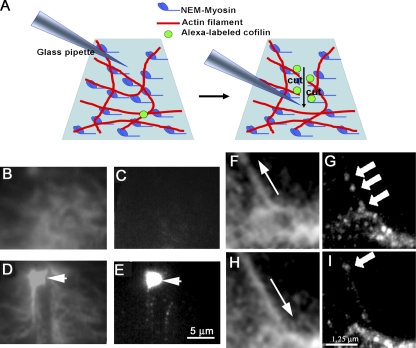
Binding of cofilin to actin filaments. (A) A schematic drawing of the experimental setup. (B–E) Time-lapse imaging of rhodamine-labeled actin filament meshwork (B and D) and IAF-labeled cofilin (C and E). (B) A meshwork of F-actin observed with TIRF microscopy before severing. (C) An IAF-labeled cofilin image acquired during 1 s with TIRF illumination. (D) A meshwork of F-actin severed by a tip of a glass pipette (arrow). (E) Cofilin images acquired during 3 s after the meshwork was severed. The arrow shows the tip of the pipette. (F) The actin bundle was relieved to the original length by displacing the tip of pipette in the direction shown by the arrow. (G) A high accumulation level of cofilin-positive spots was observed along the actin bundle 4 s after relieving a strain (Video 4). (H) A bundle of actin filaments was stretched ∼20% by displacing the tip of the pipette attached to one end of the bundle in the direction shown by the arrow. (I) A few cases of binding of cofilin to the stretched bundle were observed (cofilin fluorescent spots are shown by the arrows in G and I). Images of IAF-cofilin were accumulated during 4 s (see also Video 5). Bars: (E) 5 µm; (I) 1.25 µm.

