Figure 2.
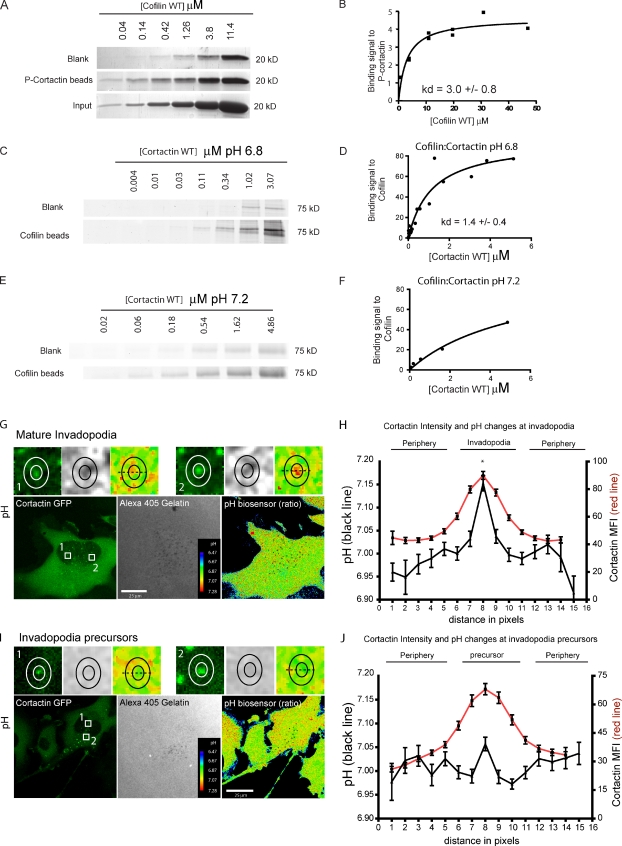
Cortactin–cofilin binding in vitro is not dependent on cortactin phosphorylation, but is pH sensitive. (A and B) Coomassie-stained gels (A) and quantification of the binding signal of cofilin to phosphorylated cortactin (B; P-cortactin; Kd = 3.0 ± 0.8 µM); data points to Kd calculation = 16. (C and D) Coomassie-stained gels (C) and quantification of the binding signal of cortactin to cofilin at pH 6.8 (D). Kd = 1.4 ± 0.4 µM; data points to Kd calculation = 22. (E and F) Coomassie-stained gels (E) and quantification of the binding signal of cortactin to cofilin at pH 7.2 (F). Kd > 4.1 ± 1.3 µM; data points =14. Invadopodia pH increases during maturation. MDA-MB-231 cells were plated on a 405-gelatin matrix for 4 h and pH changes were analyzed using the SNARF 5F pH biosensor. (G and H) Representative images of pH changes in mature invadopodia (G) and the line profile quantification of the pH changes (H). The inner ring represents the invadopodia core and the outer ring depicts the invadopodia periphery. Top panels in G show the local pH changes in detail. (I and J) Representative images of pH changes in invadopodia precursors (I) and the line profile quantification of the pH changes (J). The solid black line represents the pH fluctuations colocalizing with the cortactin accumulation (red line). n = 97 invadopodia and 106 precursors, three independent experiments, P < 0.001 between point 8 and all other points (Bonferroni test).

