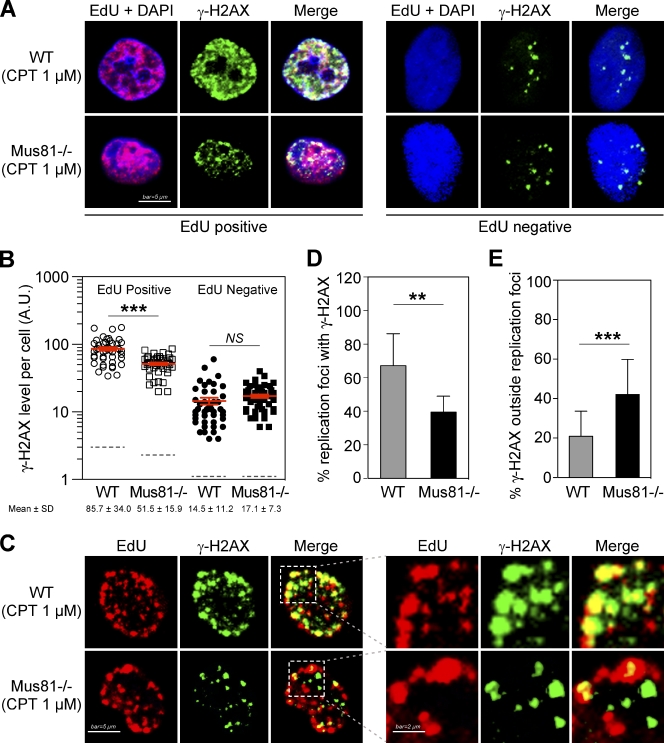
Figure 4.
Mus81-dependent DNA DSBs form at replication foci. Replication factories were labeled with EdU for 90 min. 1 µM CPT was added during the last 60 min. (A and B) Analysis of CPT-induced γ-H2AX in replicating (EdU positive) or nonreplicating (EdU negative) WT or Mus81−/− cells. (A) Representative microscopy images showing Mus81-dependent γ-H2AX response in replicating cells. (B) Quantification of γ-H2AX fluorescence signals in individual cells. 90–100 cells were scored per sample. Each dot represents a single cell. Mean values ± SEM are shown in red. Dotted lines indicate γ-H2AX mean levels in untreated cells. (C) Representative microscopy images showing the colocalization of EdU and γ-H2AX foci in EdU-positive cells. (right) Magnified images of squared areas from left images. (D and E) Detailed analysis of EdU and γ-H2AX colocalization in EdU-positive cells demonstrating that Mus81 is involved in γ-H2AX formation at replication foci. (D) Percentages of replication foci colocalized with γ-H2AX (defined as 100% x [number of EdU foci colocalizing with γ-H2AX foci divided by the total number of EdU foci]). (E) Percentages of γ-H2AX foci outside replication foci (defined as 100% x [number of γ-H2AX foci that do not colocalize with EdU foci divided by the total number of γ-H2AX foci]). 20 individual cells were scored per sample. Mean percentages ± SD are shown. **, P < 0.005; ***, P < 0.0001; Student’s t test. Blue, DAPI nuclear staining; red, EdU; green, γ-H2AX. A.U., arbitrary unit.

