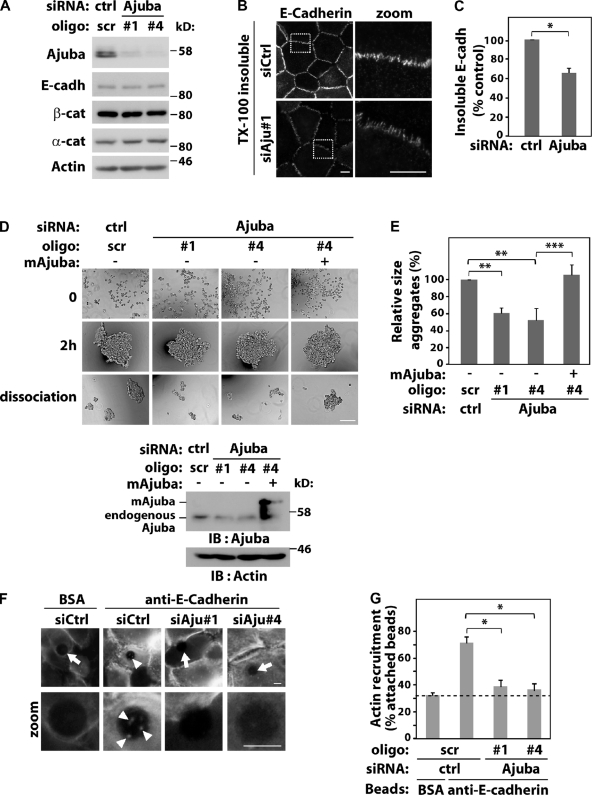
Figure 1.
Ajuba regulates junction maintenance. Keratinocytes were transfected with control scramble oligos (scr, ctrl) or Ajuba RNAi oligos with or without expression of siRNA-resistant Ajuba (mAjuba). (A) Lysates were analyzed by Western blotting with the antibodies indicated on the left. (B and C) Keratinocytes were preextracted with 0.5% Triton X-100–containing buffer, fixed, and stained for E-cadherin. The amount of E-cadherin insoluble pool at junctions was quantified and expressed relative to control (arbitrarily set as 100). (D and E) Aggregation of RNAi-treated cells was tested in hanging-drop suspension. Representative images are shown before (time 0), after addition of calcium ions for 2 h, and after moderate trituration (dissociation). Knock-down and expression of exogenous RNAi-resistant Ajuba were confirmed for each experiment. (E) Average size of all disaggregates after trituration was corrected for the size of each aggregate before trituration (2 h) and expressed relative to control samples (Scr., set as 100%). (F) siRNA-transfected cells were incubated with beads coated with BSA or anti–E-cadherin antibody. After washes, cells were fixed, stained for F-actin, and imaged. Arrows point at beads without F-actin accumulation; arrowheads show actin recruitment (zoom). (G) Quantification of data shown in F. Beads containing F-actin were visually scored and expressed as percentage of total attached beads in each sample. Dashed line represents nonspecific binding observed with control BSA-coated beads. Between 40 and 200 beads were counted for each group per experiment. Data represent mean and SD of three independent experiments (hereafter n = 3). Molecular weight markers are shown as kD (A and D). *, P < 0.03; **, P < 0.009; ***, P < 0.004. Bars: 10 µm or 200 µm.

