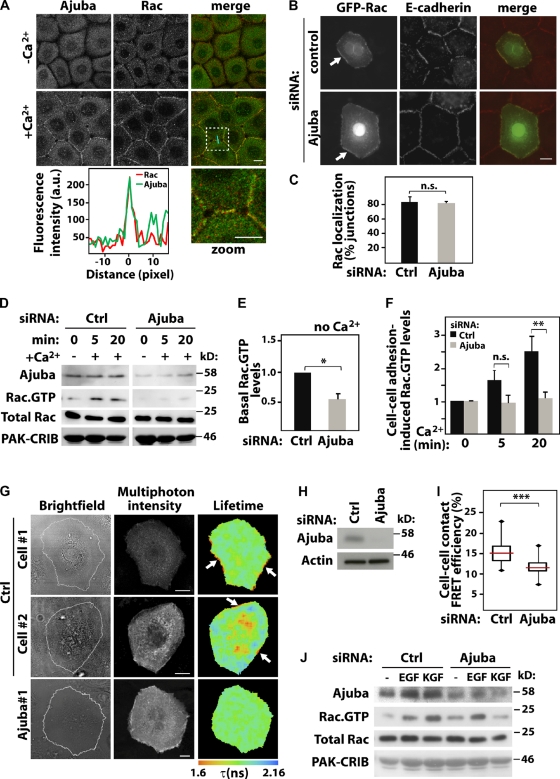
Figure 3.
Ajuba is required for Rac activation at cell–cell contacts. Keratinocytes grown in the absence of contacts (−Ca2+) were induced to form junctions by addition of calcium for 20 min (+Ca2+). Cells were stained, imaged, and localization of different constructs at junctions quantified. (A) Endogenous Ajuba and endogenous Rac relocalize upon junction assembly. Merged images and zoom of the boxed area are shown on the right. A line scan plot shows the fluorescence intensity of Rac and Ajuba at junctions. (B and C) Cells were treated with control (ctrl) or Ajuba RNAi oligo, transfected with GFP-RacWT, and stained for E-cadherin. Junctions containing GFP-RacWT were expressed as the percentage of total number of junctions in each sample. (D–I) Rac activity induced by cell–cell contact assembly was evaluated biochemically (D–F) or in situ (G–I). (D) Cells depleted of Ajuba were induced to assemble junctions for up to 20 min, and lysates used in pull-downs to determine Rac activation. Samples were probed with anti-Ajuba and anti-Rac antibodies to detect active Rac (Rac·GTP) and total levels of Rac in lysates (Total Rac). GST-PAK-CRIB is shown by Amido Black staining. Quantification of basal (without calcium, E) and junction-induced Rac·GTP levels (with calcium, F) are shown. Values are expressed relative to time-zero control in each group (scramble or Ajuba siRNA). (G) Cells depleted of Ajuba were transfected with the unimolecular biosensor mRFP1-Raichu-Rac-GFP. Multi-photon FLIM was used to image intramolecular FRET between GFP and mRFP1 upon Rac activation. Pseudocolored images show shortening of GFP fluorescence lifetime (τ, expressed in ns) as Rac activation. Two representative distributions of active Rac are shown for controls (cell #1 and #2). Arrows show Rac activation at junctions. (H) Representative blots showing Ajuba depletion. (I) FRET efficiency was measured at junctions (see Materials and methods) and shown as box plots (25th and 75th percentiles, medians as horizontal lines, and minimal/maximal values as vertical bars). About 100 contacts per condition across independent experiments were quantified. (J) Keratinocytes were stimulated with EGF or KGF and Rac activation assessed as described for D above. Graphs show the mean and standard error. n > 3. *, P < 0.04; **; P < 0.02; ***, P < 0.001. n.s., nonsignificant. Bars, 10 µm.

