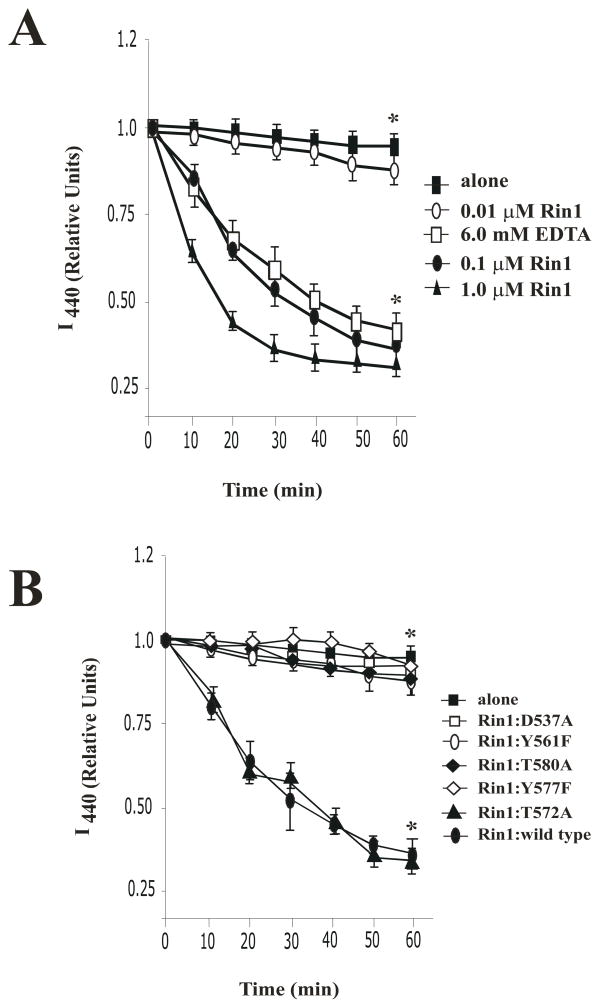
Figure 3. Rin1 mutants affect the release of mant-GDP bound to Rab5.
(A) Kinetics of mant-GDP release from 100 pM His-Rab5 in the absence (
 ) and presence of 0.01 μM (
 ), 0.1 μM (
 ), 1 μM (←) Rin1: wild type proteins or following the addition of 6 mM EDTA (
 ) for the indicated time at 30°C. The data are presented as means ± SD of three independent experiments, n=3 *P < 0.001. (B) Release of mant-GDP from 100 pM His-Rab5 alone (
 ) or in the presence of 0.1 μM Rin1 constructs for the indicated time at 30°C as described in Material and Methods. The data are presented as means ± SD of three independent experiments, n=3 *P < 0.001. Each independent experiment was carried out in duplicate. Relative Units (R.U.) indicate the amount of fluorescence measured at 440 nm (I440 nm).

