Fig. 4.

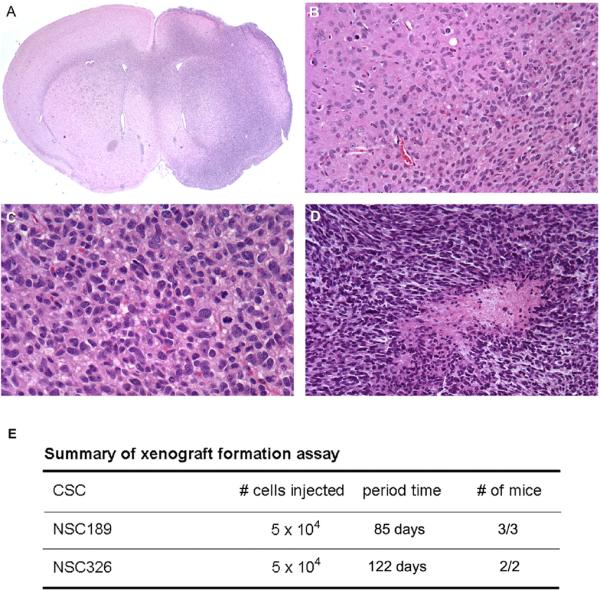
Xenograft formation assay of NSC189p3 showing the xenograft in the right side of the brain (A), infiltrating nature of the xenograft (B), mitotic activities (C), and a necrosis (D) in the xenograft. E Summary of xenograft formation assay of NSC189p3 and NSC326p3 with the numbers of cells injected, the period of time from the injection to xenograft formation and the number of mice with xenografts over total number of mice injected with the cells.
