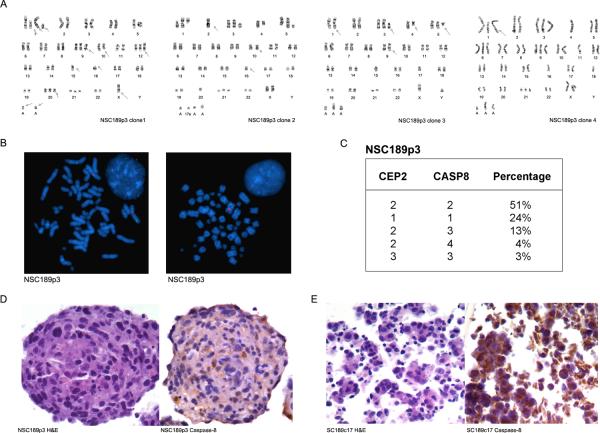
Fig. 7.
Genomic heterogeneity of NSC189. A G-banding detection of multiple genomically distinguished cell populations in NSC189p3. B FISH analysis of NSC189p3 at metaphase and interphase (inset) and detection of two copies of chromosome 2 (identified by CEP2 in red) and CASP8 (in green) in one cell population but one copy of chromosome 2 and CASP8 in another cell population. C Summary of the percentage of cells in NSC189p3 with copy numbers of chromosome 2 and CASP8 gene. D–E H&E sections (left) and immunohistochemistry (right) of NSC189p3 (D) and SC189c17 (E) showing the heterogeneous cell populations of NSC189p3 as determined by the cytoplasmic expression of caspase-8.

