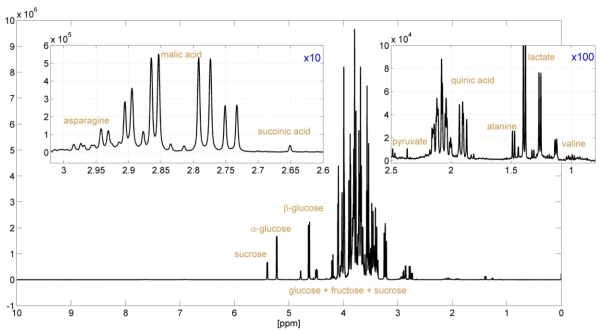
Figure 1.
1H-NMR spectrum (~4 minutes) of an apple juice and two enlargements (magnification of factor 10 and 100) showing signal assignments of a few key compounds. The x-axis (expressed as ppm relative to 400 MHz) corresponds to the chemical shifts of the proton resonances, which are dependent on the chemical environment of the protons (e.g., type of bonds and neighboring atoms). The y-value is linearly dependent on the molarity of the corresponding proton(s).

