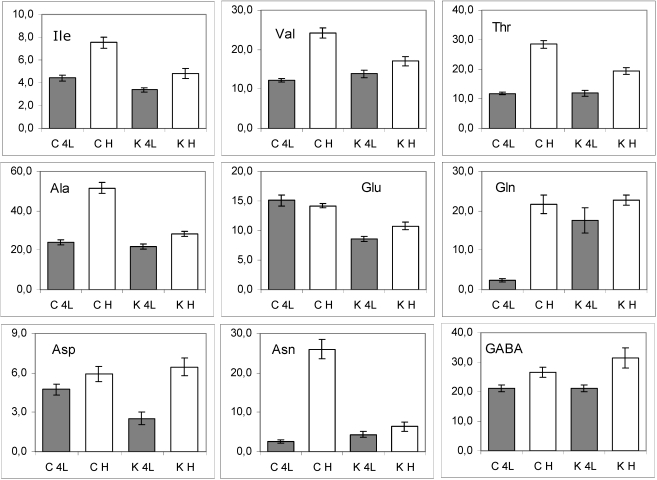
Figure 5.
The histograms of molecular abundance (mean values and standard errors) of amino acids in lettuce leaf samples. C, conventional samples; K, PetE:KNAT1 samples. K4L, GM samples at 4th leaf stage; KH, GM samples at the head stage; C4L, control samples at 4th leaf stage; CH, control samples at the head stage.

