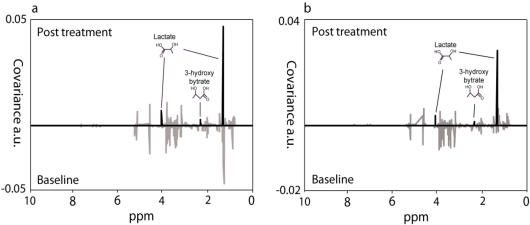
Figure 3.
Metabolite identification based on limit discriminant weight plots. Limit discriminant weight plots of back-scaled OPLS-DA data from GDL milk and probiotic milk treated patient groups with variable covariances presented with different R2 cut-off values. (a) GDL acidified milk group; (b) Probiotic milk group. Peak at δ 1.32 ppm represents the βCH3 of lactate and the peak at δ 4.10 ppm represents the αCH of lactate. The peak at δ 2.34 ppm represents the αCH2 proton of 3-hydroxybutyrate. Grey spectra show all covariances and black spectra have a cut-off value R2 > 0.6.

