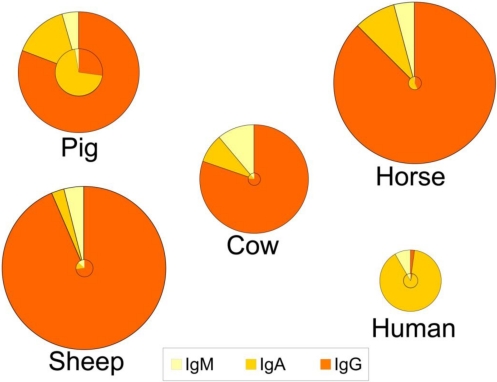
Figure 1.
Relative distribution of IgG, IgA and IgM in colostrum (outer circle) and in milk (inner circle) of five species. The relative size of the circles represents the overall concentration of total immunoglobulins found among the species and the concentrations in colostrum vs. milk. Data compiled and calculated from: cow and sheep [1]; human and pig [3]; and horse [117].

