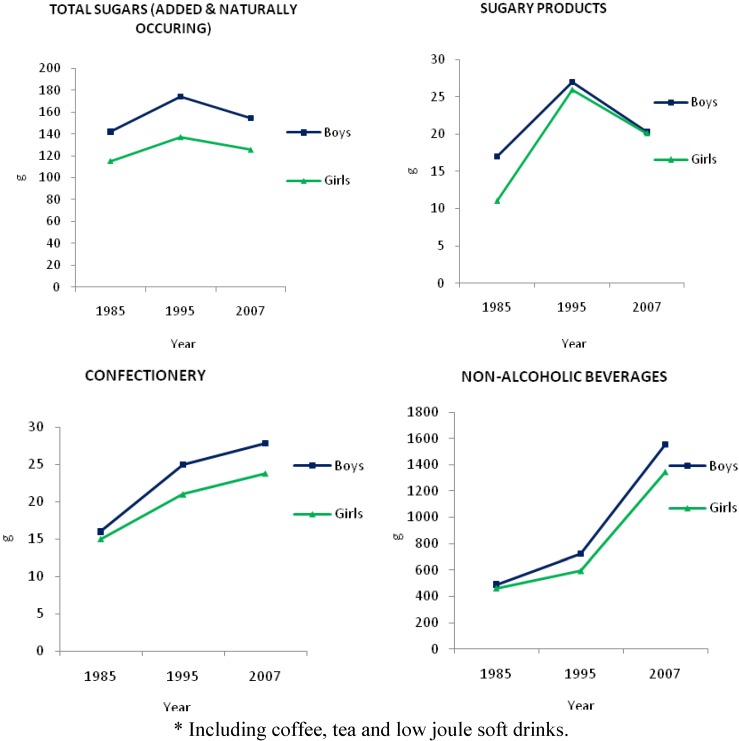
Figure 4.
24 h mean intake (g) of total sugars, sugary products, confectionery and non-alcoholic beverages * by Australian children in 1985, 1995 and 2007 [5,19]. Note: the age categories used for comparison where 10-15 year old children in years 1985 and 1995, the 2007 figure is an average between intakes of 9-13 year and 14-16 year categories.

