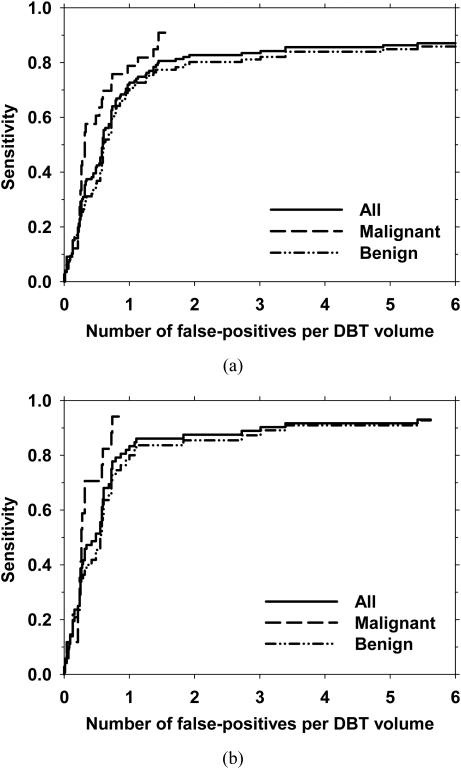
Figure 11.
The overall performance of the microcalcification detection system in terms of the FROC curves for all clusters, and the subsets of malignant clusters and benign clusters. The average number of false-positives per DBT volume was estimated using the normal data set. (a) view-based and (b) case-based detection performance. In case-based detection, a cluster was considered to be detected if the cluster was detected on either one or both views.

