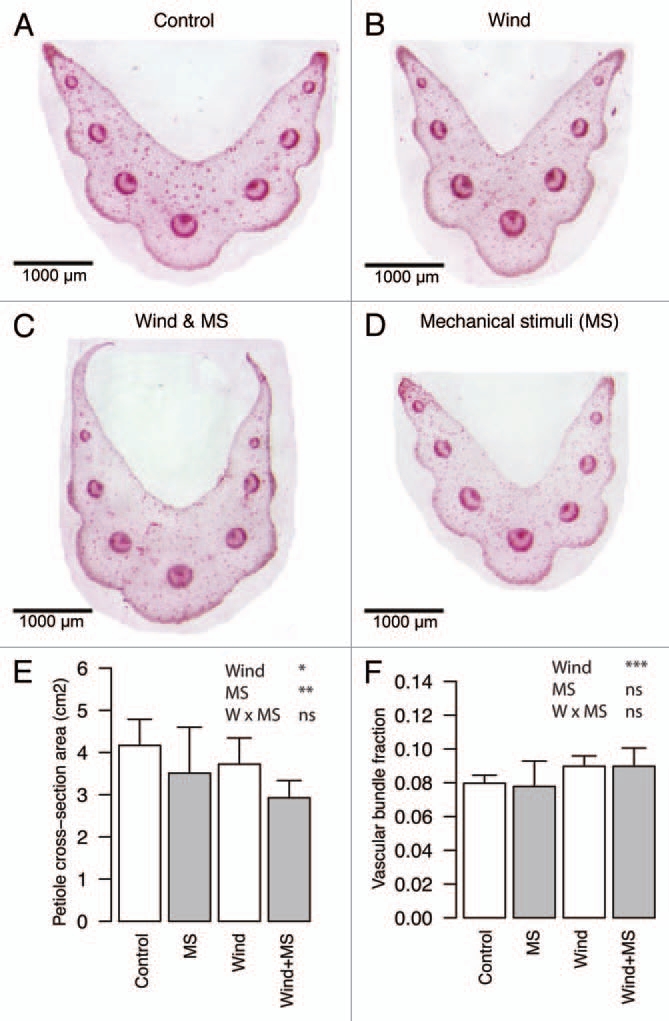
Figure 2.

Representative images of petiole cross-sections of Plantago major grown in 45 days in continuous wind and/or mechanical stimuli (A–D). Petiole cross-section area (E) and vascular bundle fraction in the cross-section of petiole (F). mean + SD (n = 12) are shown. Significance levels of ANOVA; ***p < 0.001, **p < 0.01, *p < 0.05, ns p > 0.05.
