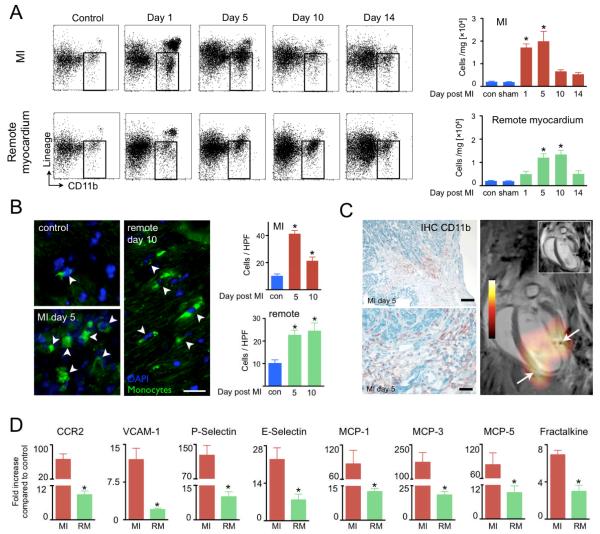
Figure 6. Monocyte/macrophage accumulation in infarct and remote myocardium.
(A) FACS analysis of CD11b+ cells (gate in dot plots) at different time points in the infarct and remote myocardium. (B) Immunofluorescence microscopy of GFP+ monocytes. Scale bar indicates 25μm. Bar graphs show GFP+ cells counted per high power field (HPF) at 200x magnification. (C) CD11b+ cells are accentuated in the border zone, where we frequently observed high PET signal. Scale bar indicates 0.1mm in upper panel and 30μm in lower panel. On the right, delayed enhancement MRI (inset) and PET/MRI long axis view on day 5 with typical border zone (arrows) configuration of signal. (D) qRT-PCR analysis in infarct (MI) and non-ischemic remote myocardium (RM) on day 5 after MI. Mean±SEM. *P<0.05.

