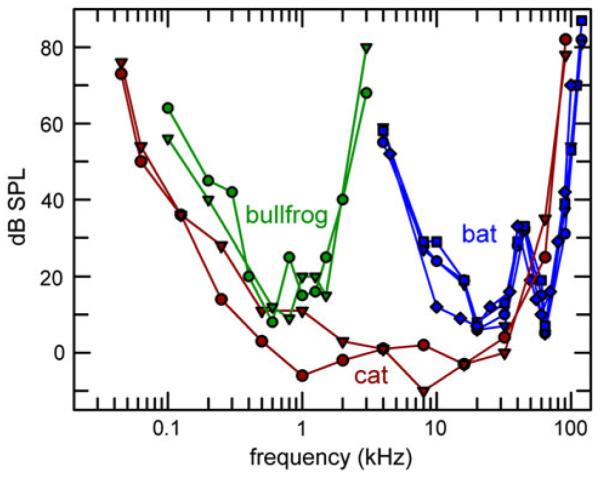
Fig. 2.

Behavioral audiograms for two bullfrogs (green circles and triangles, Megela-Simmons et al. 1985), two domestic cats (red circles and triangles, Heffner and Heffner 1985), and two big brown bats (blue diamonds, Dalland 1965; blue circles, squares, Koay et al. 1997). Big brown bats may also detect lower frequencies down to about 1 kHz, but with higher thresholds than those in the ultrasonic range (Poussin and Simmons 1982) and those in the audiogram of the domestic cat or the bullfrog. Within the most sensitive frequency range of hearing, the audiogram of the domestic cat includes frequencies common to the bullfrog and to the big brown bat, which otherwise illustrate two extreme ends of the frequency scale
