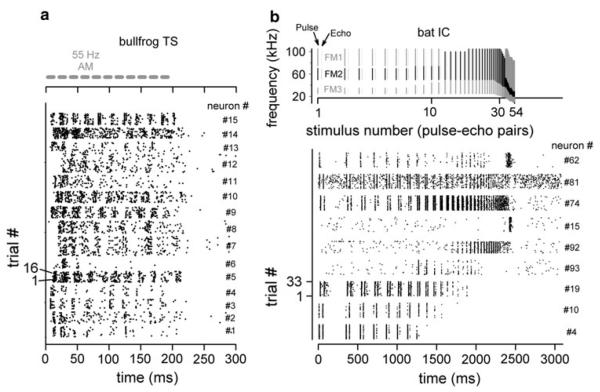
Fig. 3.
Dot raster plots showing responses of a 15 individual neurons from the bullfrog TS to repetitive 55 Hz AM noise bursts (from Simmons et al. 2000), and b responses of 9 individual neurons from the bat IC to repetitive pulse-echo patterns simulating an aerial pursuit sequence (from Ferragamo et al. 1998). Stimulus structure and timing are shown at the top of the corresponding dot raster displays. In these displays, time (response latency) is shown on the horizontal axis, and sequential stimulus presentations (trial numbers) are plotted vertically, going up from the bottom. Neuron number is shown on the right vertical axis of each plot. Responses recorded from individual neurons thus appear as vertically stacked horizontal bands stretching from left to right across time. Dots within each band register individual responses from successive stimulus presentations to that neuron. Bullfrog data are based on responses to 15–18 stimulus presentations and big brown bat data are based on responses to 32 stimulus presentations

