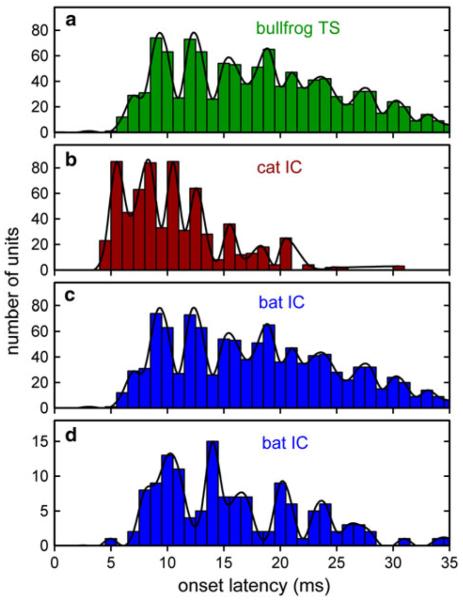
Fig. 5.
Histograms of on-response latencies in the auditory midbrain of three vertebrate species. Distribution of onset latencies in the bullfrog TS (a, 175 neurons; from Simmons et al. 2000). Data are on-responses to AM noise bursts, pooled across responses to AM rates with VS > 0.1 (lower VS values were not included in the plot). Because these are onset latencies, each neuron is recorded as having only one latency value at each AM rate. Distributions of onset latencies in the IC of the domestic cat (b, 762 neurons; from Langner and Schreiner 1988) and the big brown bat (c, 351 neurons; from Ferragamo et al. 1998; d, 133 neurons from Sanderson and Simmons 2000, 2005). Data are on-responses to tone bursts at each neuron’s best frequency. In all three species, latencies for on-responses range from an initial 4–5 ms to at 25–35 ms. Solid curves trace “preferred latencies” to highlight common temporal organization across these four latency distributions. In spite of considerable differences in experimental protocols in different experiments (e.g., species, anesthetic state, nature of stimuli), robust “preferred latencies” appear as oscillations in all four latency distributions. Oscillations are at intervals of about 2.5–3.5 ms in bullfrogs, domestic cats, and big brown bats

