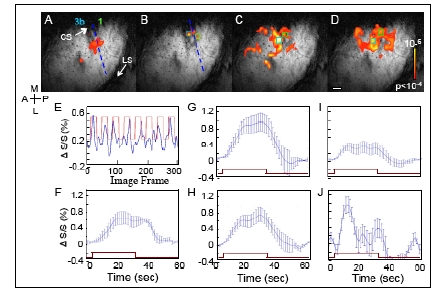
Fig. (6).

BOLD fMRI response to taps of distal finger pads. BOLD Activation maps to stimulation of (A) D2, (B) D3, (C) D2 & D3 & D4, simultaneously, and (D) D4 to D3 to D2, sequentially. Activation maps, overlaid on T2* anatomical images, were thresholded at p <0.0001 (uncorrected). Blue dashed lines in A and B indicate the estimated inter-areal border between areas 3b and 1. E. BOLD signal changes (%) derived from a single voxel in area 1 (green box in B) during D3 stimulation. Blue line shows the percent signal change over time. The red square-wave represents the timing of stimulus presentation. F. BOLD time course of E averaged across stimulation epochs. G and H. Average BOLD time courses to simultaneous D2 & D3 & D4 stimulation are shown for area 3b (G, blue box in C) and 1 (H, green box in C). I and J. Average BOLD time courses observed in response to sequential D2 & D3 & D4 stimulation in areas 3b (I, derived from light blue box in D) and 1 (J, derived from green box in D). Note the different ratios of activation between areas 3b and 1 during the simultaneous and motion stimuli. Error bars = 1 StDev. Brown rectangle indicates the time of stimulation. Scale bar = 1mm.
