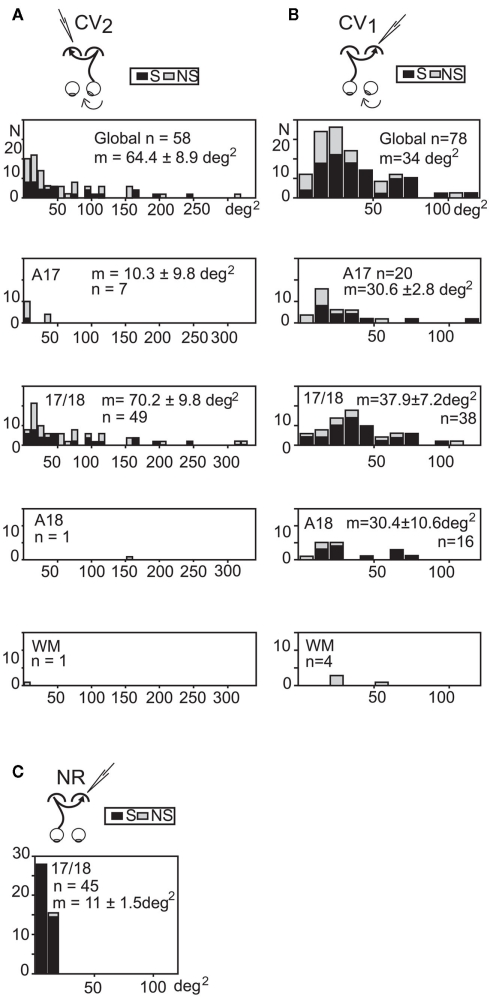
Figure 5.
Distribution of the sizes of the “transcallosal” receptive fields in the various explored cortical areas of strabismic and normally reared cats. (A,B) In each strabismic group, units were recorded from A17, A18, the 17/18 TZ (17/18) and the white matter (WM). Global, units from all areas. (C) TC units in the NR group were only found in the 17/18 TZ. S: orientation selective units; NS: units with no orientation selectivity. m: mean receptive field size ±SD. n: number of units. Bin width, 10 degrees2. Data from the CV1 and the NR group have been reproduced with permission from Milleret and Houzel (2001). See text for further details.

