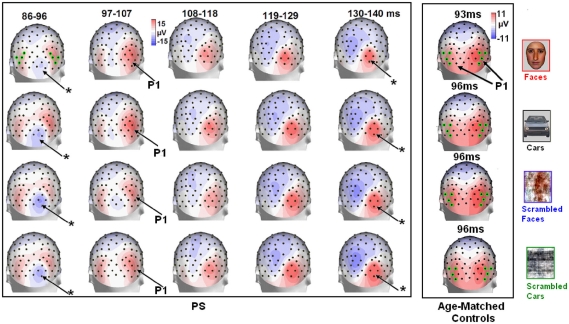
Figure 4.
Evolution of electrophysiological responses to visual stimulation at the back of the head for patient PS. Following visual stimulation, large evoked potentials were recorded on the right posterior medial sites, over PS’ main lesion, with an alternation of negative and positive current flows out of the brain (negative at 75–85 ms, positive at 130–140 ms). These unusual components (indicated in the figure with an asterisk) were most prominent before and after the lateral P1 component. The P1 topography (at the latency at which the component reached its highest amplitude) for the age –matched controls is also shown for comparison.

