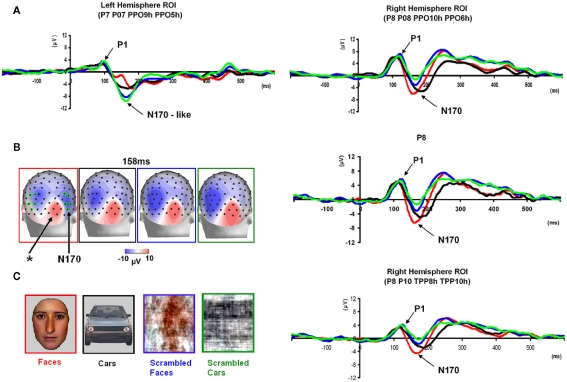
Figure 5.
Waveforms recorded over PS’ scalp following visual stimulation in the four conditions. The waveforms correspond to an average of eight recording sessions (averaged of each session displayed in Figure 6) in which 86 trials were presented for each condition. The first response was identified as a P1, which did not differ much across conditions, but was slightly delayed and larger for scrambled stimuli. The second visual component showed a typical N170 response profile (see the topographic maps displayed at the latency at which the N170 amplitude was highest) only in the right hemisphere (larger response to meaningful stimuli, larger and earlier response to faces than cars). Its topography was slightly different than in normal controls due to the presence of a large unusual visual component recorded on the right posterior medial channels, over the main right hemisphere lesion (indicated in the figure with an asterisk). The “N170-like” component, recorded on electrode sites over the left lateral occipital channels, did not show any of the characteristics associated with an N170, presenting the largest response to phase-scrambled stimuli and the lowest and most delayed response to faces. Different ROIs are presented because the larger response to faces than the other conditions was most pronounced on more anterior lateral channels (B,C) than on channels where all conditions elicited the largest N170 (A).

