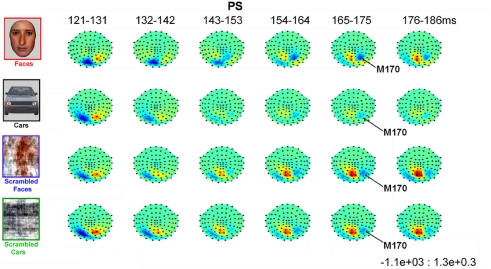
Figure 8.
Evolution of magnetic fields evoked by visual stimulation as recorded by 102 magnetometers for patient PS averaged across 10 ms time windows around the M170 component in Experiment 1 (viewed from above, nasion upward; data are interpolated linearly between sensors, indicated by black dots, after their spherical projection onto a 2D surface). Red and blue indicate outward and inward radial direction of magnetic flux through single flux coils within the helmet (in units of fT).

