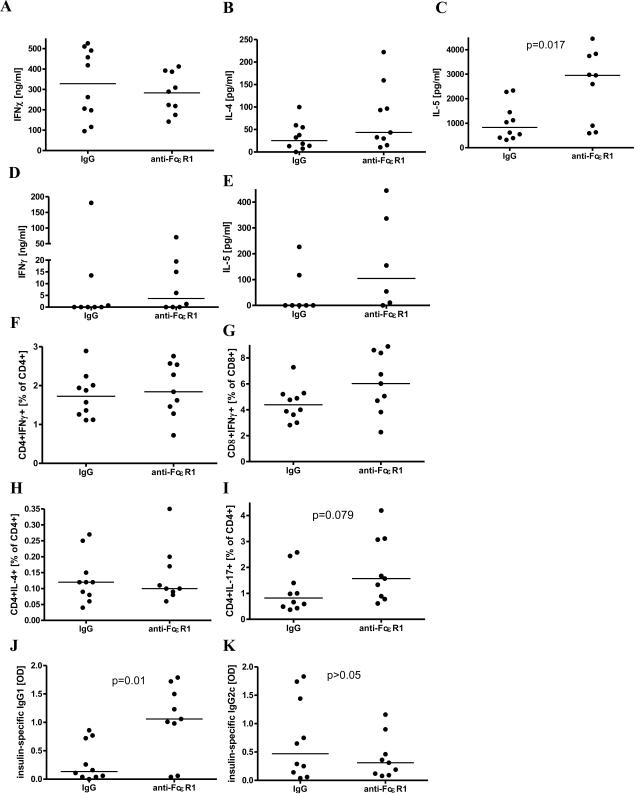
Figure 4. Cytokine and antibody response after 10 weeks of anti-FcεR1/isotype treatment at 16 weeks of age.
(A) IFNγ, (B) IL-4, and (C) IL-5 cytokine production from spleen cells and (D) IFNγ and (E) IL-5 cytokine production from pancreatic lymph node cells in response to anti-CD3/anti-CD28. (F) Frequency of splenic CD4+IFNγ+ and (G) CD8+IFNγ+, as well as (H) CD4+IL-4+ and (I) CD4+IL-17+ T cells in response to anti-CD3/anti-CD28. (J) Plasma levels of insulin-specific IgG1 and (K) IgG2c. Statistical significance between groups was assessed by the Mann-Whitney test. Shown are the results from two independent experiments with a total of 9-10 animals per group.

