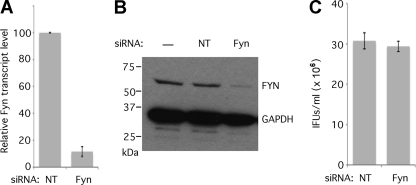
Fig. 3.
Characterization of Fyn knockdown cells. (A) Transcript levels of Fyn mRNA (normalized to the amount of GAPDH mRNA) were quantified at 48 h posttransfection using the Quantigene2.0 system. The means of three replicate experiments are shown (error bars indicate standard errors of the means [SEM]). The difference was significant (P < 0.0001). (B) Total cellular protein was extracted and separated by SDS-PAGE, transferred by Western blotting, and probed with anti-Fyn and anti-GAPDH (loading control) antibodies. There is a significant reduction is Fyn protein levels after siRNA knockdown. NT, nontargeting siRNA. (C) Cultures infected at 48 h after knockdown by nontargeting or Fyn siRNA were lysed, and infectious progeny were replated for inclusion forming unit (IFU) determination. IFUs per field were counted for at least 20 fields, and IFUs/ml were calculated and plotted (n = 3; error bars indicate SEM). The difference was not significant.

